This Friday, May 4, 2012 the US Government Bureau Of Labor Statistics [BLS] will release the April 2012 Non-Farm Payrolls report, better known as an "obfuscation of economic Truth". Because America can't handle the Truth!
The April 2012 Non-Farm Payrolls should, for lack of a better word, "suck". The headline unemployment number "should" rise as the number of "jobs created" comes in "less than expected".
Unfortunately, the BLS data is far from accurate, or representative of the truth, so we best resign ourselves to a fabricated number to make our Crybaby President look like his economic policies are genius.
Still, a lie, is a lie, is a lie. The data we have been spoon fed by the mainstream financial media courtesy of the government data magicians hardly adds up when looked at closely:
When Data Is Spun, What Data Can We Trust? (April 30, 2012)
oftwominds / Charles Hugh Smith
"Headline" government data is massaged, falsified or spun for the purpose of perception management: believe the headlines at your own risk.
Modern investing offers the promise that investors who "do their homework" and use data more intelligently than the herd can gain a valuable edge. But what if the underlying data available to the investing public is fundamentally flawed?
The federal government agencies that issue headline data and the mainstream media that reprints the data without skeptical analysis would have us believe that these indicators -- the unemployment rate and the consumer price index (CPI), for example -- accurately reflect economic realities.
The other indicator that is implicitly or explicitly assumed to reflect the economy’s health is, of course, the stock market, generally represented by the S&P 500 index.
That the government indicators and the stock market are both suspect is now a given.
The chart below, one of many possible examples, proves this suspicion is well-founded. This is a chart of a broad measure of employment in the U.S. published by the U.S. Department of Labor, Bureau of Labor Statistics (BLS). As we can see, when 140 million people had jobs in 2009, the official unemployment rate was 7.3%.
Yet when 140 million people had jobs in early 2012, the unemployment rate was 8.3%. How can the rate change when the number of jobs remain constant? The reason is that the unemployment rate is based not just on the number of jobs but on the number of people who are ready, willing and able to work—the labor force. The unemployment rate is based on the labor force minus the number of employed equals the number of people counted as unemployed.
The government games the unemployment rate by keeping the labor force number artificially low. Despite the working-age population rising by 9.4 million people since 2008, the official labor force has been 154 million since 2008. Where did the government put all those millions new workers? In the “not in the labor force” category, which rose by roughly 8 million since early 2009. In other words, dropping millions of people from the labor force artificially lowers the unemployment rate.
It doesn’t take any fancy analysis to conclude that if the true labor force were counted, then the unemployment rate would be much higher -- and that is, of course, politically unacceptable.

So the numbers are gamed, massaged, adjusted... However you choose to describe it, the “headline number” of unemployment reflects political expediency, not reality.
The same can be said of the CPI and a slew of other headline data points issued by the government and blithely accepted by a corporate mainstream media committed to presenting the “recovery” as real.
If We Can’t Trust Headline Indicators, What Can We Trust?
If these headline indicators are not a reliable reflection of economic reality, what is?
To the degree that any government statistic can be massaged, seasonally adjusted, or simply rejiggered behind the curtain, we must always be alert to the possibility that numbers have been gamed for political expediency.
But the farther we move away from headline numbers, the farther we also get from the political pressure to make the numbers either positive or benign. For example, relatively few people are going to study chart PRS85006173, showing labor’s share of the non-farm business sector (i.e., the vast majority of the economy).

This charts reveals that labor’s share of the economy has been falling sharply since the dot-com top in 2000, and has been in a downtrend of lower highs and lower lows since 1982. This suggests that the number of counted jobs (which includes part-time, temporary, and self-reported self-employed) may be less valuable as a metric of economic recovery than income and labor’s share of the economy.
READ MORE
_________________
Biderman On The Fed: "They Control The Market, We Play With Their Money"
From Zerohedge
The pastel-wearing President of TrimTabs proffers an entirely non-perfunctory prose explaining why he believes we are now due for a stock market decline. Echoing our thoughts, Charles notes that "It's the Federal Reserve that controls the market, it's their money, they're the boss, we play with their money that they print or stop printing". Sadly true (especially for all the highly-paid economists and strategists out there), the pre-2009 drivers of equity performance (specifically new or excess savings) are no longer so; since the initial QE1 this has not been the case and providing us with a thoughtful history of equity market valuations relative to the various QE-efforts over the past few years - especially when compared to income growth and/or macro-economic data - provides just the color required to comprehend this essentially a obvious thread of reality that merely four years ago would have been denigrated to the tin-foil-hat-wearers of the world. Real-time data says that wages and salaries are barely growing above inflation, Europe is a disaster, and the emerging nations are seeing slowing growth; without the Fed's new money where will cash come from to drive stock prices higher?
_________________
Silver – I’m Buying The Inverse Head & Shoulders – Mike Maloney (Delayed Public Release)
Published on May 1, 2012 by whygoldandsilver
http://www.goldsilver.com This is an ‘Insiders’ report that was sent out to our customers a few weeks ago, advising of the impending inverse head and shoulders pattern forming on the gold and silver charts. Usually these videos are for our Insiders only, but every now and then we release one to the public so that folks can see one of the main benefits of being a GoldSilver.com Insider: we let our customers know how we are investing as this bull market unfolds, sharing our research and analysis. In this case, Mike and many of the team here at GoldSilver.com had made large purchases of US Silver Eagles, warranting this update video. We have had many questions of late as to what the Insiders program entails, so we have made a short info clip on it at the end of this video. If you have any questions, please check our website or call 1-888-319-8166
Mike also points out in this update that the European crisis is worsening, and there are now even more nails in the dollar’s coffin than before. Human nature is playing its role in the market, as people become accustomed to the bad news (and a relatively flat silver price)…BRICS, PIIGS, just more reasons why many of our team have ramped up their accumulation program and changed their gold/silver purchase allocation ratios. Don’t forget to get our free report on the 6 precious metals scams to avoid, like Mike says, ‘Get educated!’.
Thanks for watching, may all your investments have a silver lining.
The team at GoldSilver.com
_________________
Mike is absolutely right. You cannot wait for the coming US Dollar collapse to protect your wealth...you must be preparing NOW. NOW, at these relativelylow Precious Metals prices, you should be accumulating "physical" bullion to insure and protect you wealth. Once the US Dollar collapses, it will be far to late to buy the protection offered by the ownership of physical Gold and Silver. When these precious metals go "no offer", you will not be able to find any to purchase...you will financially naked.
_________________
 http://www.brotherjohnf.com/wp-content/uploads/2012/05/SILVER5112.jpg
_________________
GATA's Bill Murphy exposes how the Gold Cartel is Bombing the Market for Precious Metals
Published on Apr 30, 2012 by CapitalAccount
Welcome to Capital Account. In one of his writings, a leading English art critic of the Victorian era, John Ruskin, told the story of a man who boarded a ship carrying his entire wealth in a large bag of gold coins. When a storm hit a few days into the voyage and the decision was made to abandon ship, the man strapped the bag around his waist, jumped overboard, and sank straight to the bottom of the sea. The man’s body was found with the wreck of the ship many years later. Reflecting on this, Ruskin asked “Now, as he was sinking, had he the gold? Or had the gold him?”
We tell you this story to impress upon you the enduring value that gold has held in the minds of people through the centuries. It has represented not only a store of value, but a means to an end…any end, including one that concludes at thebottom of the sea.
For muchof Western history, gold has been synonymous with money. It was not so long ago that the United States and Europe fixed their currencies to gold, and despite the free floating currency regime that we have had since the end of Bretton Woods in the early 1970s, one could argue that we are still on a defacto gold standard.
After all, gold has been rising steadily, and at times rather frenetically, since 2001, when it was trading at below 300 dollars per ounce, to levels nearing 2000 dollars in the past year. There are those, like Nouriel Roubini, who have been calling it a bubble since at least 2009. One of the good things about markets is that they tend to have a mind of their own, and don’t care all too much what academics or policy makers think.
But evenif markets don’t need policymakers, policymakers still need markets, and the gold market in particular is one that central bankers keep a close eye on. Gold, as our guest James Turk said in a recent interview with us, is the messenger, and what it has been telling us is that people don’t trust governments and they definitley don’t trust central banks.
But how far are governments, central banks and their too-big-to-fail handlers willing to go in order to silence the messenger? Is market manipulation by governments real, and if so, how is it being done and where? Joining us to discuss this, and other golden news is Bill Murphy, Chairman of the Gold Anti-Trust Action Committee and veteran of the precious metals space. Bill Murphy has been raising the alarm of manipulation in the precious metals market since at least 1999, and has been a prominent voice among defenders of free markets and sound currency.
_________________
As if we need any more proof that the Gold Cartel is beating down the prices of Gold and Silver in the "paper" CRIMEX market to "protect themselves" from annihilation for failure to make delivery on their massive unback short positions in both metals, Monday the whole global trading community got to witness first hand these desperados criminal hijinx in broad daylight:
Manipulative Gold ‘Fat Finger’ Or Algo Trade Worth $1.24 Billion
GoldCore
The gold market was briefly shaken by an unusually large early morning sell order, which triggered a brief trading halt in gold futures and left traders questioning whether the transaction was a mistake and the motivation of the seller.
 Gold 3 Day Chart – (Bloomberg)
Gold fell $14 in one minute despite no breaking financial and economic news and despite no movement in the dollar, oil, equity or bond markets.
There was only the insignificant personal income and spending numbers – which came in slightly better than expected and could not justify such quick falls.
CME Group Inc's Comex division recorded an unusually large transaction of 7,500 gold futures during just one minute of trading. The sale took out blocks of bids as large as 84 contracts in one fell swoop and cut prices down $15 to $1,648.80 a troy ounce.
The sharp losses triggered a 10-second trading halt in June-delivery gold futures, CME told Dow Jones Newswires Tatyana Shumsky.
"The market was given a short period to recalibrate and ... it was for 10 seconds," a CME spokesman said. "It only happened in gold futures, in the June gold contract."
Gold traders buzzed with speculation that the transaction was an input error - a so-called "fat finger" trade. "Or a Gold Finger as it might be known in the bullion market," traders at Citi joked in a note to clients.
The massive size of the transaction - 750,000 troy ounces worth more than $1.24 billion – led to speculation that it was either a mistake by a trader or that an entity wished to manipulate the market lower.
Such large trades have frequently been seen at month and quarter beginning and ends. Yesterday was the last trading day of the month. They have also been seen when Ben Bernanke has been making important statements regarding the dollar and the outlook for the US economy.
The nature of the massive sell order, one of many seen in recent months, suggested that the seller was not motivated by profit and may have had other motives. Such large trades are rarely conducted amid very thin trading volumes.
Trading yesterday was expected to be quiet as market participants in China and Japan were out on holiday and many European traders were preparing for May Day holidays today.
"No one who has the account size and the money to trade thousands of gold contracts would do it in one transaction; that's just stupid," said one trader.
 Silver 3 Day Chart – (Bloomberg)
It seems likely that the seller was either a large hedge fund or institution as the collateral required to purchase 7,500 contracts is high. The seller would have had to have deposited $ 75.9 million in cash with a broker.
There was a suggestion in the Reuters Global Gold Forum that the selling may have been due to algorithm trading or computer driven.
The trade could be as a result of the shift to electronic trading. Computer trading systems are vulnerable to input errors, as they do not ‘question’ the order before executing the transaction.
By contrast, when most order flow would pass through the Comex floor where human traders processed the deals, potential errors stand higher chances of being intercepted and there is a higher level of transparency.
"You would definitely [verify a trade this big] before you executed it," said one Comex floor broker.
However, the trade is unlikely to have been a keystroke error as silver also saw substantial selling at the same time and similar price falls.
This suggests that the seller wished to see gold and silver prices lower. Some traders suggest that there may be High Frequency Trading (HFT) programmes that can see where stop loss orders are placed and sell in order to force stop loss selling – then buying back and thus making a quick profit.
It will further fuel allegations that certain Wall Street banks, either alone or in conjunction with the Federal Reserve and US Treasury, are intervening in and manipulating prices in the precious metal markets.
The Gold Anti Trust Action Committee (GATA) and other knowledgeable market participants have alleged that this is continuing to be done in order to maintain faith in the US dollar and the US capital markets.
FAT FINGER IN SILVER TOO?
Trader Dan's Market Views
Traders continue to chatter about the so-called "FAT FINGER" trade in gold that occurred early this morning, a trade which dropped the gold price $15 in minutes and consisted of an order of 7,500 contracts. Many seem to agree that it was a trade placed in error.
The problem is that we also witnessed a similar surge in the volume done in the nearby silver pit at the exact same moment. Note the time right after the 5:00 AM hour (Pacific time) on the following 5 minute chart and see how large the volume was compared to that for the remainder of the session.
No matter who did the trade, ( I remain of the opinion that this was a raid designed to knock the metal lower in hopes of creating a cascading running of downside sell stops), the fact is that it failed miserably. Besides, if it was a "FAT FINGER" ( a trade placed in error) how did the same fat finger knock silver down so sharply? Was that too a simple "error".
Note how both metals recovered the losses and added some additional gains even with the mining shares weaker and the broader equity markets lower. Even copper was lower today for a while before it too moved higher.
I still believe that traders are becoming more convinced that another round of QE is coming sooner rather than later. At least that is what is being reflected in the price action.

Finally, WSJ Reports of Suspicious Activity in Gold Market
Posted by Dominique de Kevelioc de Bailleul on May 01, 2012
Better late then never for a mainstream financial publication to notice what seasoned professionals of the gold market have known for decades—the gold market trades in mysterious ways.
“The CME Group Inc.’s Comex division recorded an unusually large transaction of 7,500 goldfutures during one minute of trading at 8:31 a.m. EDT,” Wall Street Journal’s Tatyana Shumsky penned in an Apr. 30 article, titled, Gold market shakes off $1.24 billion ‘fat finger’. “The sale took out blocks of bids as large as 84 contracts in one fell swoop and cut prices down to $1,648.80 a troy ounce. The overall transaction was worth more than $1.24 billion.”
Shumsky then writes that there is speculation among traders of a ‘fat finger’ in the market place that day—maybe a mistake, she reckons, maybe an “input error.”
Instead of calling up Bill Murphy or Chris Powell at Gold Anti-Trust Action Committee (GATA) for their take on such a peculiar trade, the gumshoe hound reported comments made by Citi traders, instead.
A ‘fat finger’, “or a Gold Finger as it might be known in the bullion market,” she quoted Citi traders in their note to clients regarding the incident.
To her credit, however, the determination of Shumsky to get to the bottom of this mystery didn’t lead her to solicit a comment from JP Morgan’s Blythe Masters. There, Masters most likely would have replied that she was shocked, shocked at such shenanigans would ever take place at the CME establishment.
“One indicator that the transaction was a mistake was its size,” Shumsky brilliantly surmised. “At 750,000 troy ounces, such large trades are rarely conducted amid very thin trading volumes. Monday trading was expected to be quiet as market participants in China and Japan are out on holiday and many European traders are preparing for a holidays there.”
Like a city beat reporter who daringly suggests that men showing up at a bank on a holiday to make a deposit through the back door at 3 a.m. was apparently fishy, Shumsky captured the event eloquently so that the reader could make up his own mind of the event.
“No one who has the account size and the money to trade thousands of gold contracts would do it in one transaction, that’s just stupid,” WSJ’s Barney Fife quoted a trader. “The collateral required to purchase 7,500 contracts is about $75.9 million in cash that the trader would have deposited with his broker.”
In her dogged determination to collect varying opinions of what happened, Shumsky met up with a seasoned Wall Street pro, where she then finds the plot thickening.
“Still, not everyone agreed Monday’s slip in gold was caused by a keystroke error,” she stated. “Chuck Retzky, director of futures sales for Mizuho Securities USA, said that silver prices suffered a similar leg down at the same time as gold, tumbling 35 cents to $30.805 a troy ounce, but other markets like Treasurys, currencies and stocks were unperturbed.”
Now that uncovered anomaly is something Jack Anderson would have offered effusive kudos to the meticulous WSJ reporter—a budding Junior Mogambo Ranger, of whom most certainly Richard Daughty would be proud.
________________
Is the mainstream financial press FINALLY catching on to and REPORTING the TRUTH on the Gold Cartel manipulations of the Gold and Silver markets.
Any market manipulation concerns from the Crybaby President?
_________________
Time to Accumulate Gold and Silver
By Jeff Clark
05/01/12
Do you own enough gold and silver for what lies ahead?
If 10% of your total investable assets (i.e., excluding equity in your primary residence) aren’t held in various forms of gold and silver, we at Casey Research think your portfolio is at risk.
After speaking at the Cambridge House conference last month and talking with many attendees, I came away convinced that most investors fall into one of two categories: those who hold an abundance of gold and silver (which tends to be physical forms only), and those with little or none. While both groups need to diversify, I’m a little more concerned about the second group. Here’s why.
Regardless of what you think will happen over the remainder of this decade, one thing seems virtually certain: the value of paper money will be affected, perhaps dramatically. Even if the economy slipped into deflation, the deflation wouldn’t last long. A panicked Fed would print to the max and set off a wild rise in prices. This is why we’re convinced currency dilution will not only continue but accelerate.
Let’s take a look at what’s happened so far with the value of our currency vs. gold, after accounting for the loss in purchasing power.

Both the US and Canadian dollar, after adjusting for their respective CPIs, have lost about a quarter of their purchasing power just since 2000. Concurrently, gold has increased dramatically in buying power, far outpacing the effects of inflation.
This is the core reason why I’m convinced we should hold our savings in gold and silver instead of dollars.
Mayan prophecies aside, many of our panelists last month, including most of the senior Casey staff, believe economic, monetary, and fiscal pressures could come to a head this year. The massive build-up of global debt, continued reckless deficit spending, and the lack of sound political leadership to reverse either trend point to a potentially ugly tipping point. What happens to our investments if we enter another recession or — gulp — a depression?
Here’s an updated snapshot of the gold price during each recession since 1955.

Clearly, one should not assume that gold will perform poorly during a recession. Even in the crash of 2008, gold still ended the year with a 5% gain. And with the amount of currency dilution we’ve undergone since that time, it seems more likely gold will rise in any economic contraction than fall. Indeed, if the response of government to a recession is more money printing, precious metals will be a critical asset to have in your possession.
Even if the gold price ends up flat or down this year, the CPI won’t. Gold’s enduring purchasing power is why we hold the metal.
How about gold stocks?

In spite of the debilitating 1970s that suffered from stagflation, price controls, three recessions, and the Vietnam war, gold producers rose over 600% while the S&P was basically flat. And that includes a roughly 65% fire-sale correction, much like we saw in 2008. To be clear, gold and silver stocks won’t be immune to selloffs if a recession or worse temporarily clobbers our industry. But in the end, we’re convinced they will prevail.
Don’t lose patience with, or confidence in, your gold holdings. What happens to the price over any short period of time is only one chapter in the book of this bull market, and we think you’ll be happy by the time that last chapter is written.
_______________
Got Gold You Can Hold?
Got Silver You Can Squeeze?
It's NOT Too Late To Accumulate!!!
The April 2012 Non-Farm Payrolls should, for lack of a better word, "suck". The headline unemployment number "should" rise as the number of "jobs created" comes in "less than expected".
Unfortunately, the BLS data is far from accurate, or representative of the truth, so we best resign ourselves to a fabricated number to make our Crybaby President look like his economic policies are genius.
Still, a lie, is a lie, is a lie. The data we have been spoon fed by the mainstream financial media courtesy of the government data magicians hardly adds up when looked at closely:
When Data Is Spun, What Data Can We Trust? (April 30, 2012)
oftwominds / Charles Hugh Smith
"Headline" government data is massaged, falsified or spun for the purpose of perception management: believe the headlines at your own risk.
Modern investing offers the promise that investors who "do their homework" and use data more intelligently than the herd can gain a valuable edge. But what if the underlying data available to the investing public is fundamentally flawed?
The federal government agencies that issue headline data and the mainstream media that reprints the data without skeptical analysis would have us believe that these indicators -- the unemployment rate and the consumer price index (CPI), for example -- accurately reflect economic realities.
The other indicator that is implicitly or explicitly assumed to reflect the economy’s health is, of course, the stock market, generally represented by the S&P 500 index.
That the government indicators and the stock market are both suspect is now a given.
The chart below, one of many possible examples, proves this suspicion is well-founded. This is a chart of a broad measure of employment in the U.S. published by the U.S. Department of Labor, Bureau of Labor Statistics (BLS). As we can see, when 140 million people had jobs in 2009, the official unemployment rate was 7.3%.
Yet when 140 million people had jobs in early 2012, the unemployment rate was 8.3%. How can the rate change when the number of jobs remain constant? The reason is that the unemployment rate is based not just on the number of jobs but on the number of people who are ready, willing and able to work—the labor force. The unemployment rate is based on the labor force minus the number of employed equals the number of people counted as unemployed.
The government games the unemployment rate by keeping the labor force number artificially low. Despite the working-age population rising by 9.4 million people since 2008, the official labor force has been 154 million since 2008. Where did the government put all those millions new workers? In the “not in the labor force” category, which rose by roughly 8 million since early 2009. In other words, dropping millions of people from the labor force artificially lowers the unemployment rate.
It doesn’t take any fancy analysis to conclude that if the true labor force were counted, then the unemployment rate would be much higher -- and that is, of course, politically unacceptable.
So the numbers are gamed, massaged, adjusted... However you choose to describe it, the “headline number” of unemployment reflects political expediency, not reality.
The same can be said of the CPI and a slew of other headline data points issued by the government and blithely accepted by a corporate mainstream media committed to presenting the “recovery” as real.
If We Can’t Trust Headline Indicators, What Can We Trust?
If these headline indicators are not a reliable reflection of economic reality, what is?
To the degree that any government statistic can be massaged, seasonally adjusted, or simply rejiggered behind the curtain, we must always be alert to the possibility that numbers have been gamed for political expediency.
But the farther we move away from headline numbers, the farther we also get from the political pressure to make the numbers either positive or benign. For example, relatively few people are going to study chart PRS85006173, showing labor’s share of the non-farm business sector (i.e., the vast majority of the economy).
This charts reveals that labor’s share of the economy has been falling sharply since the dot-com top in 2000, and has been in a downtrend of lower highs and lower lows since 1982. This suggests that the number of counted jobs (which includes part-time, temporary, and self-reported self-employed) may be less valuable as a metric of economic recovery than income and labor’s share of the economy.
READ MORE
_________________
Biderman On The Fed: "They Control The Market, We Play With Their Money"
From Zerohedge
The pastel-wearing President of TrimTabs proffers an entirely non-perfunctory prose explaining why he believes we are now due for a stock market decline. Echoing our thoughts, Charles notes that "It's the Federal Reserve that controls the market, it's their money, they're the boss, we play with their money that they print or stop printing". Sadly true (especially for all the highly-paid economists and strategists out there), the pre-2009 drivers of equity performance (specifically new or excess savings) are no longer so; since the initial QE1 this has not been the case and providing us with a thoughtful history of equity market valuations relative to the various QE-efforts over the past few years - especially when compared to income growth and/or macro-economic data - provides just the color required to comprehend this essentially a obvious thread of reality that merely four years ago would have been denigrated to the tin-foil-hat-wearers of the world. Real-time data says that wages and salaries are barely growing above inflation, Europe is a disaster, and the emerging nations are seeing slowing growth; without the Fed's new money where will cash come from to drive stock prices higher?
_________________
Silver – I’m Buying The Inverse Head & Shoulders – Mike Maloney (Delayed Public Release)
Published on May 1, 2012 by whygoldandsilver
http://www.goldsilver.com This is an ‘Insiders’ report that was sent out to our customers a few weeks ago, advising of the impending inverse head and shoulders pattern forming on the gold and silver charts. Usually these videos are for our Insiders only, but every now and then we release one to the public so that folks can see one of the main benefits of being a GoldSilver.com Insider: we let our customers know how we are investing as this bull market unfolds, sharing our research and analysis. In this case, Mike and many of the team here at GoldSilver.com had made large purchases of US Silver Eagles, warranting this update video. We have had many questions of late as to what the Insiders program entails, so we have made a short info clip on it at the end of this video. If you have any questions, please check our website or call 1-888-319-8166
Mike also points out in this update that the European crisis is worsening, and there are now even more nails in the dollar’s coffin than before. Human nature is playing its role in the market, as people become accustomed to the bad news (and a relatively flat silver price)…BRICS, PIIGS, just more reasons why many of our team have ramped up their accumulation program and changed their gold/silver purchase allocation ratios. Don’t forget to get our free report on the 6 precious metals scams to avoid, like Mike says, ‘Get educated!’.
Thanks for watching, may all your investments have a silver lining.
The team at GoldSilver.com
_________________
Mike is absolutely right. You cannot wait for the coming US Dollar collapse to protect your wealth...you must be preparing NOW. NOW, at these relativelylow Precious Metals prices, you should be accumulating "physical" bullion to insure and protect you wealth. Once the US Dollar collapses, it will be far to late to buy the protection offered by the ownership of physical Gold and Silver. When these precious metals go "no offer", you will not be able to find any to purchase...you will financially naked.
_________________
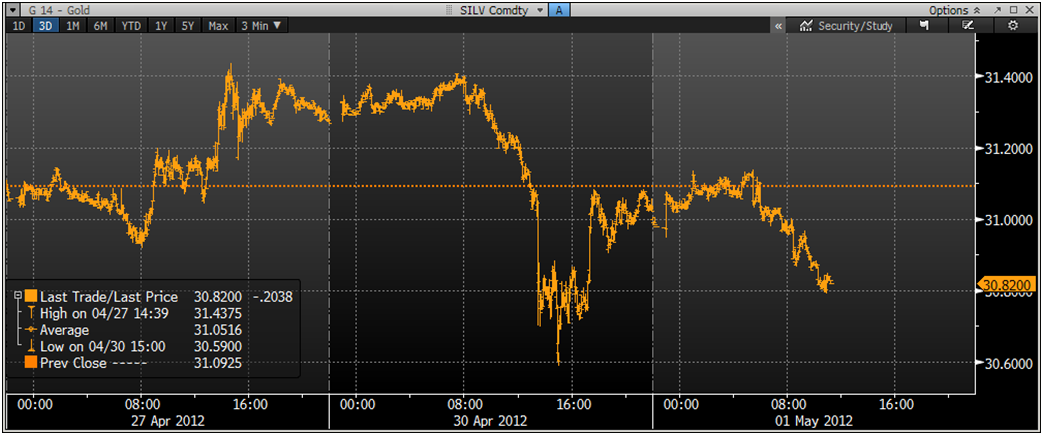
Trend Channel Firming. New Key Level 31.5by brotherjohnf on Tuesday, May 1st, 2012
 http://www.brotherjohnf.com/wp-content/uploads/2012/05/SILVER5112.jpg
_________________
GATA's Bill Murphy exposes how the Gold Cartel is Bombing the Market for Precious Metals
Published on Apr 30, 2012 by CapitalAccount
Welcome to Capital Account. In one of his writings, a leading English art critic of the Victorian era, John Ruskin, told the story of a man who boarded a ship carrying his entire wealth in a large bag of gold coins. When a storm hit a few days into the voyage and the decision was made to abandon ship, the man strapped the bag around his waist, jumped overboard, and sank straight to the bottom of the sea. The man’s body was found with the wreck of the ship many years later. Reflecting on this, Ruskin asked “Now, as he was sinking, had he the gold? Or had the gold him?”
We tell you this story to impress upon you the enduring value that gold has held in the minds of people through the centuries. It has represented not only a store of value, but a means to an end…any end, including one that concludes at thebottom of the sea.
For muchof Western history, gold has been synonymous with money. It was not so long ago that the United States and Europe fixed their currencies to gold, and despite the free floating currency regime that we have had since the end of Bretton Woods in the early 1970s, one could argue that we are still on a defacto gold standard.
After all, gold has been rising steadily, and at times rather frenetically, since 2001, when it was trading at below 300 dollars per ounce, to levels nearing 2000 dollars in the past year. There are those, like Nouriel Roubini, who have been calling it a bubble since at least 2009. One of the good things about markets is that they tend to have a mind of their own, and don’t care all too much what academics or policy makers think.
But evenif markets don’t need policymakers, policymakers still need markets, and the gold market in particular is one that central bankers keep a close eye on. Gold, as our guest James Turk said in a recent interview with us, is the messenger, and what it has been telling us is that people don’t trust governments and they definitley don’t trust central banks.
But how far are governments, central banks and their too-big-to-fail handlers willing to go in order to silence the messenger? Is market manipulation by governments real, and if so, how is it being done and where? Joining us to discuss this, and other golden news is Bill Murphy, Chairman of the Gold Anti-Trust Action Committee and veteran of the precious metals space. Bill Murphy has been raising the alarm of manipulation in the precious metals market since at least 1999, and has been a prominent voice among defenders of free markets and sound currency.
_________________
As if we need any more proof that the Gold Cartel is beating down the prices of Gold and Silver in the "paper" CRIMEX market to "protect themselves" from annihilation for failure to make delivery on their massive unback short positions in both metals, Monday the whole global trading community got to witness first hand these desperados criminal hijinx in broad daylight:
Manipulative Gold ‘Fat Finger’ Or Algo Trade Worth $1.24 Billion
GoldCore
The gold market was briefly shaken by an unusually large early morning sell order, which triggered a brief trading halt in gold futures and left traders questioning whether the transaction was a mistake and the motivation of the seller.
Gold 3 Day Chart – (Bloomberg)Gold fell $14 in one minute despite no breaking financial and economic news and despite no movement in the dollar, oil, equity or bond markets.
There was only the insignificant personal income and spending numbers – which came in slightly better than expected and could not justify such quick falls.
CME Group Inc's Comex division recorded an unusually large transaction of 7,500 gold futures during just one minute of trading. The sale took out blocks of bids as large as 84 contracts in one fell swoop and cut prices down $15 to $1,648.80 a troy ounce.
The sharp losses triggered a 10-second trading halt in June-delivery gold futures, CME told Dow Jones Newswires Tatyana Shumsky.
"The market was given a short period to recalibrate and ... it was for 10 seconds," a CME spokesman said. "It only happened in gold futures, in the June gold contract."
Gold traders buzzed with speculation that the transaction was an input error - a so-called "fat finger" trade. "Or a Gold Finger as it might be known in the bullion market," traders at Citi joked in a note to clients.
The massive size of the transaction - 750,000 troy ounces worth more than $1.24 billion – led to speculation that it was either a mistake by a trader or that an entity wished to manipulate the market lower.
Such large trades have frequently been seen at month and quarter beginning and ends. Yesterday was the last trading day of the month. They have also been seen when Ben Bernanke has been making important statements regarding the dollar and the outlook for the US economy.
The nature of the massive sell order, one of many seen in recent months, suggested that the seller was not motivated by profit and may have had other motives. Such large trades are rarely conducted amid very thin trading volumes.
Trading yesterday was expected to be quiet as market participants in China and Japan were out on holiday and many European traders were preparing for May Day holidays today.
"No one who has the account size and the money to trade thousands of gold contracts would do it in one transaction; that's just stupid," said one trader.
Silver 3 Day Chart – (Bloomberg)It seems likely that the seller was either a large hedge fund or institution as the collateral required to purchase 7,500 contracts is high. The seller would have had to have deposited $ 75.9 million in cash with a broker.
There was a suggestion in the Reuters Global Gold Forum that the selling may have been due to algorithm trading or computer driven.
The trade could be as a result of the shift to electronic trading. Computer trading systems are vulnerable to input errors, as they do not ‘question’ the order before executing the transaction.
By contrast, when most order flow would pass through the Comex floor where human traders processed the deals, potential errors stand higher chances of being intercepted and there is a higher level of transparency.
"You would definitely [verify a trade this big] before you executed it," said one Comex floor broker.
However, the trade is unlikely to have been a keystroke error as silver also saw substantial selling at the same time and similar price falls.
This suggests that the seller wished to see gold and silver prices lower. Some traders suggest that there may be High Frequency Trading (HFT) programmes that can see where stop loss orders are placed and sell in order to force stop loss selling – then buying back and thus making a quick profit.
It will further fuel allegations that certain Wall Street banks, either alone or in conjunction with the Federal Reserve and US Treasury, are intervening in and manipulating prices in the precious metal markets.
The Gold Anti Trust Action Committee (GATA) and other knowledgeable market participants have alleged that this is continuing to be done in order to maintain faith in the US dollar and the US capital markets.
FAT FINGER IN SILVER TOO?
Trader Dan's Market Views
Traders continue to chatter about the so-called "FAT FINGER" trade in gold that occurred early this morning, a trade which dropped the gold price $15 in minutes and consisted of an order of 7,500 contracts. Many seem to agree that it was a trade placed in error.
The problem is that we also witnessed a similar surge in the volume done in the nearby silver pit at the exact same moment. Note the time right after the 5:00 AM hour (Pacific time) on the following 5 minute chart and see how large the volume was compared to that for the remainder of the session.
No matter who did the trade, ( I remain of the opinion that this was a raid designed to knock the metal lower in hopes of creating a cascading running of downside sell stops), the fact is that it failed miserably. Besides, if it was a "FAT FINGER" ( a trade placed in error) how did the same fat finger knock silver down so sharply? Was that too a simple "error".
Note how both metals recovered the losses and added some additional gains even with the mining shares weaker and the broader equity markets lower. Even copper was lower today for a while before it too moved higher.
I still believe that traders are becoming more convinced that another round of QE is coming sooner rather than later. At least that is what is being reflected in the price action.
Finally, WSJ Reports of Suspicious Activity in Gold Market
Posted by Dominique de Kevelioc de Bailleul on May 01, 2012
Better late then never for a mainstream financial publication to notice what seasoned professionals of the gold market have known for decades—the gold market trades in mysterious ways.
“The CME Group Inc.’s Comex division recorded an unusually large transaction of 7,500 goldfutures during one minute of trading at 8:31 a.m. EDT,” Wall Street Journal’s Tatyana Shumsky penned in an Apr. 30 article, titled, Gold market shakes off $1.24 billion ‘fat finger’. “The sale took out blocks of bids as large as 84 contracts in one fell swoop and cut prices down to $1,648.80 a troy ounce. The overall transaction was worth more than $1.24 billion.”
Shumsky then writes that there is speculation among traders of a ‘fat finger’ in the market place that day—maybe a mistake, she reckons, maybe an “input error.”
Instead of calling up Bill Murphy or Chris Powell at Gold Anti-Trust Action Committee (GATA) for their take on such a peculiar trade, the gumshoe hound reported comments made by Citi traders, instead.
A ‘fat finger’, “or a Gold Finger as it might be known in the bullion market,” she quoted Citi traders in their note to clients regarding the incident.
To her credit, however, the determination of Shumsky to get to the bottom of this mystery didn’t lead her to solicit a comment from JP Morgan’s Blythe Masters. There, Masters most likely would have replied that she was shocked, shocked at such shenanigans would ever take place at the CME establishment.
“One indicator that the transaction was a mistake was its size,” Shumsky brilliantly surmised. “At 750,000 troy ounces, such large trades are rarely conducted amid very thin trading volumes. Monday trading was expected to be quiet as market participants in China and Japan are out on holiday and many European traders are preparing for a holidays there.”
Like a city beat reporter who daringly suggests that men showing up at a bank on a holiday to make a deposit through the back door at 3 a.m. was apparently fishy, Shumsky captured the event eloquently so that the reader could make up his own mind of the event.
“No one who has the account size and the money to trade thousands of gold contracts would do it in one transaction, that’s just stupid,” WSJ’s Barney Fife quoted a trader. “The collateral required to purchase 7,500 contracts is about $75.9 million in cash that the trader would have deposited with his broker.”
In her dogged determination to collect varying opinions of what happened, Shumsky met up with a seasoned Wall Street pro, where she then finds the plot thickening.
“Still, not everyone agreed Monday’s slip in gold was caused by a keystroke error,” she stated. “Chuck Retzky, director of futures sales for Mizuho Securities USA, said that silver prices suffered a similar leg down at the same time as gold, tumbling 35 cents to $30.805 a troy ounce, but other markets like Treasurys, currencies and stocks were unperturbed.”
Now that uncovered anomaly is something Jack Anderson would have offered effusive kudos to the meticulous WSJ reporter—a budding Junior Mogambo Ranger, of whom most certainly Richard Daughty would be proud.
________________
Is the mainstream financial press FINALLY catching on to and REPORTING the TRUTH on the Gold Cartel manipulations of the Gold and Silver markets.
Any market manipulation concerns from the Crybaby President?
_________________
Time to Accumulate Gold and Silver
By Jeff Clark
05/01/12
Do you own enough gold and silver for what lies ahead?
If 10% of your total investable assets (i.e., excluding equity in your primary residence) aren’t held in various forms of gold and silver, we at Casey Research think your portfolio is at risk.
After speaking at the Cambridge House conference last month and talking with many attendees, I came away convinced that most investors fall into one of two categories: those who hold an abundance of gold and silver (which tends to be physical forms only), and those with little or none. While both groups need to diversify, I’m a little more concerned about the second group. Here’s why.
Regardless of what you think will happen over the remainder of this decade, one thing seems virtually certain: the value of paper money will be affected, perhaps dramatically. Even if the economy slipped into deflation, the deflation wouldn’t last long. A panicked Fed would print to the max and set off a wild rise in prices. This is why we’re convinced currency dilution will not only continue but accelerate.
Let’s take a look at what’s happened so far with the value of our currency vs. gold, after accounting for the loss in purchasing power.
Both the US and Canadian dollar, after adjusting for their respective CPIs, have lost about a quarter of their purchasing power just since 2000. Concurrently, gold has increased dramatically in buying power, far outpacing the effects of inflation.
This is the core reason why I’m convinced we should hold our savings in gold and silver instead of dollars.
Mayan prophecies aside, many of our panelists last month, including most of the senior Casey staff, believe economic, monetary, and fiscal pressures could come to a head this year. The massive build-up of global debt, continued reckless deficit spending, and the lack of sound political leadership to reverse either trend point to a potentially ugly tipping point. What happens to our investments if we enter another recession or — gulp — a depression?
Here’s an updated snapshot of the gold price during each recession since 1955.
Clearly, one should not assume that gold will perform poorly during a recession. Even in the crash of 2008, gold still ended the year with a 5% gain. And with the amount of currency dilution we’ve undergone since that time, it seems more likely gold will rise in any economic contraction than fall. Indeed, if the response of government to a recession is more money printing, precious metals will be a critical asset to have in your possession.
Even if the gold price ends up flat or down this year, the CPI won’t. Gold’s enduring purchasing power is why we hold the metal.
How about gold stocks?
In spite of the debilitating 1970s that suffered from stagflation, price controls, three recessions, and the Vietnam war, gold producers rose over 600% while the S&P was basically flat. And that includes a roughly 65% fire-sale correction, much like we saw in 2008. To be clear, gold and silver stocks won’t be immune to selloffs if a recession or worse temporarily clobbers our industry. But in the end, we’re convinced they will prevail.
Don’t lose patience with, or confidence in, your gold holdings. What happens to the price over any short period of time is only one chapter in the book of this bull market, and we think you’ll be happy by the time that last chapter is written.
_______________
Got Gold You Can Hold?
Got Silver You Can Squeeze?
It's NOT Too Late To Accumulate!!!

No comments:
Post a Comment