The untold reality of gold and silver price controls
Consider for a moment the remarkably high volume of COMEX contracts traded during the days when the spot prices for gold and/or silver were driven sharply lower.
An illusion of weakness tends to prevail in these situations because the majority of precious metal traders do not seem to understand the difference between a paper claim and the real thing, nor do they seem to realize that only paper contracts or claims are being sold when the price of the precious metals drops — not the actual metal itself. Basically, the futures contract seller cannot be forced to deliver physical metal, and so sellers can simply settle their profit or loss on the trade in cash.
Furthermore, the fact that such price drops are typically initiated by the dumping of huge swaths of paper contracts by proprietary traders working at giant bullion banks that are too big to bail and/or fail, makes them seem more like manipulative attempts to scare the precious metals market into a selling panic.
No one is actually selling real bullion during these allegedly “not-for-profit”-led precious metal sell-offs. Instead, the paper market is moving the metal prices as the tail seemingly wags the dog.
____________________________
Silver price targeting and the will of central banks
Perhaps one of the most frustrating things about trading the precious metals is that price action unfortunately directs perception. As GATA's Chris Powell has pointed out, movements in the price makes market commentary.
So, as soon as the price of silver drops, investors start to think that silver is heading down to $4 again. Conversely, when the price of silver rises, then they tend to think it must be a bubble. This cycle seems crazy considering the ever-depreciating value of the U.S. dollar.
Perhaps instead of looking at the price, investors could simply open up the COT report and follow the flow of paper futures and option contracts if they want to know the state of a currency or financial system.
____________________________
Silver's Four Hour Slamdown Window

As silver suffers its biggest one-day drop of the year, following a February of strange 'spikey' behavior, we thought it might be useful to show just what has been going on for the last few weeks. It appears that from the open of US equity trading pre-market to the close of Europe's equity markets (~0730ET to ~1130ET), Silver has been offered non-stop. Out of that four-hour window, on average, Silver has not moved in the month of February. With the dramatic nature of physical demand at the Mint, this serial slam-down of Silver just seems a little too premeditated and predictable.
February has seen more than its fair share of price drops...

____________________________
Bank short silver positions near record, risk squeeze
Last Friday night (European time) the Bank Participation Report for Feb. 5 was released. This showed that the U.S. banks reduced their net short gold position by 12,886 contracts over the month of January, while non-U.S. banks increased theirs by 2,887 contracts. This is evidence that the U.S. banking community is aggressively closing its short positions. A little of this was picked up by the non-bank commercials (mostly mines, refiners and processors) whose net shorts increased by 6,512 contracts to 56,573.
In silver they were unable to close down their positions, the U.S. banks increasing their exposure by 7,956 contracts over the month. The non-U.S. banks increased their short positions by 457 contracts, representing more than 42 million ounces between them to give a total short position of 277,810,000 ounces, the second highest on record.
The two charts below show the contrasting positions for U.S. banks in gold and silver.


We can be sure that the massive short position in silver is causing difficulties for the banks concerned, because of the lack of physical supply. Therefore, the bullion banks have an exposure that appears to be out of control. While they frequently conduct bear raids (which are more successful in gold) they face the risk in silver of themselves becoming victims in a bear squeeze. Unusually, they have got themselves into this mess on a low silver price, and it is roughly double the short position when the silver price was over $40. This being the case, when silver turns up the banks are likely to be very badly squeezed, throwing up enormous losses. Meanwhile, the non-bank commercials have kept a level head and reduced their net short position by 2,268 contracts to 3,616.
It is against that background that gold and silver prices declined this week, with gold falling about $30 to the $1,630 level, and silver by $1.50 to the $30.25 level. Given that the bullion banks are trying to close down their positions, you would expect open interest to fall. Instead they have both risen, gold by more than 25,000 contracts and silver by 2,936 contracts, indicating that buyers are taking the opportunity to accumulate at these low prices.
____________________________
Gold's Regular Morning Mugging
A broad daylight crime-in-progress?
Tuesday, February 19, 2013, 8:38 PM
The Evidence
The precious metals are routinely sold off at or soon after the 8:20am EST morning open of the New York NYMEX exchange.
Below are the daily gold price charts (source: Kitco) for each Monday (or Tuesday, if Monday was a holiday) since early this year. The current day's gold price is noted by the bright green line. The morning takedown is highlighted by the orange oval.
Monday, January 7
Gold is taken down $10 immediately after the 8am NYMEX open

Monday, January 14
A late breaking rally begun on the London exchange is quickly contained at the NYMEX open, and then beaten down nearly $10. Notice that the previous Friday's gold price action (the bright blue line) also showed the same behavior at the same time, but with an even more severe response once the NYMEX opened.

Monday, January 21
The 8am sell-off is smaller here (only a few $), but still noticeable.

Monday, January 28
Again, a sell-off happens after the 8am open. Note again how the previous Friday's action was similar, but even more severe.

Monday, February 4
Finally, an outlier. While there was an initial dip in the first hour of the NYMEX, the price took off soon after. So let's not count this one.

Monday, February 11
An immediate $14 drop at the 8am open. The downward momentum started in London, but the vertical downdraft once the NYMEX opened is unmistakable.

Tuesday, February 19
While less sharp, the steady selling clearly begins at 8am, beating gold down $12 to the technically significant $1,600 threshold.

Volume & Timing
Running the above data by Chris, he noted two additional observations.
The first is that the price suppression is commencing increasingly in advance of the start of the NYMEX's open outcry process at 8:20am EST (i.e., how trading happens at the NYMEX). This suggests that it's being done on behalf of powerful players granted permission to circumvent the rules.

The second is that the volume levels in this pre-open trading is similar to that seen during active hours. That is very unusual in markets, and exceptionally high.

________________________________
Gene Arensberg's GGR: Gold futures setup becoming bullish
Tuesday, February 19, 2013
HOUSTON – Yesterday we released a new Got Gold Report to Subscribers covering recent changes in the positioning of the largest traders of futures on the COMEX in New York. In that report we detail that a majority of the recent selling pressure for gold futures has been coming from what many would say is an unusual source, if the record-high short positions taken by those traders is any guide (which it almost certainly is).
Unless a quantum shift is underway, which seems implausible, those very high short positions should become the “highest of high octane rally fuel” once "The Funds" believe the downward impulse for gold is exhausted.
What is also a bit of a “tell” in our view is that the very high short positions put on by Managed Money traders has been gold-specific. As we conclude in the special Got Gold Report article: “… we have come to the conclusion that the Funds are in the process of pulling off one of the great head fakes of our trading career. … Either that or they have correctly positioned for the gold market to collapse while forgetting to do the same for silver.”
Since sending the report out we have received multiple requests from colleagues we respect and admire to share our work in the public domain - an honor we cannot in good conscience deny. So, below is a link to the entire article, including all the important charts and data, in PDF format.
Hopefully readers will find it worthy of their time.
Read the entire report: "Gold COT Imbalanced, Becoming Bullish"
Download 20130218 GGR COT Notes (Please allow a few moments to load.)
***
Below is just one example of the many important charts (and data) in the full GGR . It is the record high short gold position held by the usually net long traders the CFTC classes as "Managed Money," aka "The Funds," on February 12, 2013 - just before gold fell sharply, tripping sell stops and trailing stops to test near $1,600.
Clearly the recent selling pressure for gold futures can be directly attributed to The Funds. The natural hedgers and bullion banks have actually been DECREASING their collective net short positioning recently, as the data in the report shows.
Gene Arensberg for Got Gold Report
________________________________
Gold finds record shorts among managed money
This week considerable instability developed in currency markets. The yield on US Treasuries has been rising, signalling that they may have bottomed out. And when it emerged from the FOMC minutes that some members are worrying about the commitment to buy Treasuries and mortgage securities, while the British MPC were thinking of renewed QE, sterling had its biggest one-day fall for months.
Why does this matter for precious metals? It matters simply because there are some extreme positions in Comex futures. Volatility has picked up, with gold sliding $60 to a low of $1554 mid-week, and silver being marked down with it to a low of $28.25.
Managed money (i.e. hedge funds) is short 47,357 gold contracts, a record, and can be seen as the red line in the chart below, and there are 45 funds short, well over twice the average and very close to the record of 48. Furthermore, their net long position (green line) is close to all-time lows.

Interestingly, the last time managed funds held record shorts was in May 2012, when gold bottomed out at $1540, before rallying to the $1800 October high. On that basis, managed funds in gold are as good a contrary indicator as you can get.
The bullion banks, which control prices in futures markets, are reducing their shorts and have cut their net short position in gold by 60,000 contracts, the lion’s share of the reduction being the counterpart of the managed money position. The Commitment of Traders report to be released tonight (UK time) will make fascinating reading, and it is a reasonable supposition that commercials longs have increased substantially while managed funds have gone even more short. The subsequent bear squeeze will be a wonder to behold.
Silver is a big problem for the bullion banks, as discussed in last week’s report. Since then open interest has increased further on price falls, suggesting the price is being muscled down despite resolute silver buying.
Managed money behaviour is different with silver, but bears further analysis. There are 16 shorts against a long-term average of 12, and there are 35 longs against a long-term average of 38. What this adds up to is the managed funds in silver are broadly cautious to neutral, so not so susceptible to emotional swings as in gold, which explains why the bullion banks are having difficulty closing their shorts.
____________________________
Physical Vs. Paper: Is The Gold/Silver Price Correction Over?
February 19, 2013
The cyclical ebbs and flows of Comex open interest in gold and silver futures trading is a somewhat arcane topic that receives very little blog commentary and, with a couple exceptions out of London, zero mainstream media attention and Wall Street analysis. But if you follow what has become a pattern endemic to the Comex precious metals open interest data, you can gain an information and trading edge on the rest of the market.
Last Monday, after looking at the increase in open interest on the Comex, I opined to some colleagues that I believed that the increase in open interest over the past week was a product of large hedge funds chasing the momentum and chart technicals of the gold market lower. I suggested that we would know if my theory was correct when the Friday Commitment of Traders Report (COT) was released. For those who don't know, the cut-off date for this report is the prior Tuesday. The CME reported a large increase in the gold futures open interest for both the previous Friday and the Tuesday COT cut-off day.
As it turned out, not only was my hunch correct, but the increase in the weekly hedge fund short position is the largest weekly increase since May last year and the large hedge fund gross short position in Comex gold - 10.1 million ozs/293 tonnes - is the largest hedge fund short position in gold dating back to May 2005. The Got Gold Report posts an excellent COT table which shows breakdown in the various COT trader categories (Commercial/big bank, large spec, small spec): Weekly COT report. Here's the link to the Got Gold Report Blog: GGR
Why do we care about this? To review, the COT report is segregated basically into the Commercial Traders, which include users/producers of gold/silver and Wall Street dealers; the large speculators, which are the hedge funds; and the small speculators, which are the retail account traders. Historically, the trading pattern is that the large specs continually increase their net long position in gold/silver when the market is moving higher. Since futures are a zero sum game, for every buyer there has to be a seller. Accordingly, the big Wall Street banks take the other side of the large spec net long position.
When the large spec gross long position runs up to a relatively high level, it's usually a signal that the market is getting ready to correct. As such, we will observe an inordinately high level in the Commercial category short position. This typically starts a period of cliff-dive type down days, as the hedge funds all seem to rush for the exits at once and the Wall Street dealers use that selling to cover their short position. It's a wash/rinse/repeat cycle.
In the last few years, a new pattern has emerged toward the end of particularly vicious price correction cycles. The large hedge funds, after liquidating a significant amount of long positions, start to "chase" the downward momentum of the market and pile into the short side. Concomitantly, we will observe the commercials/banks cover their short position - taking it to a relatively low level - and start to actually get long the market (or less net short, as it were).
After 12 years of studying the Comex open interest and COT patterns, I've gotten pretty good at "sniffing out" when market is behaving like the hedge funds are piling into the short side. As you can see from the chart below, this pattern also is a very good indicator that a price correction cycle is ending (i.e. gold/silver prices are bottoming out):
(click to enlarge)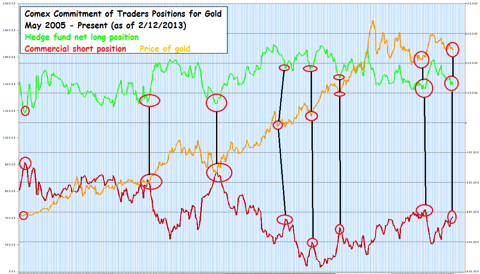
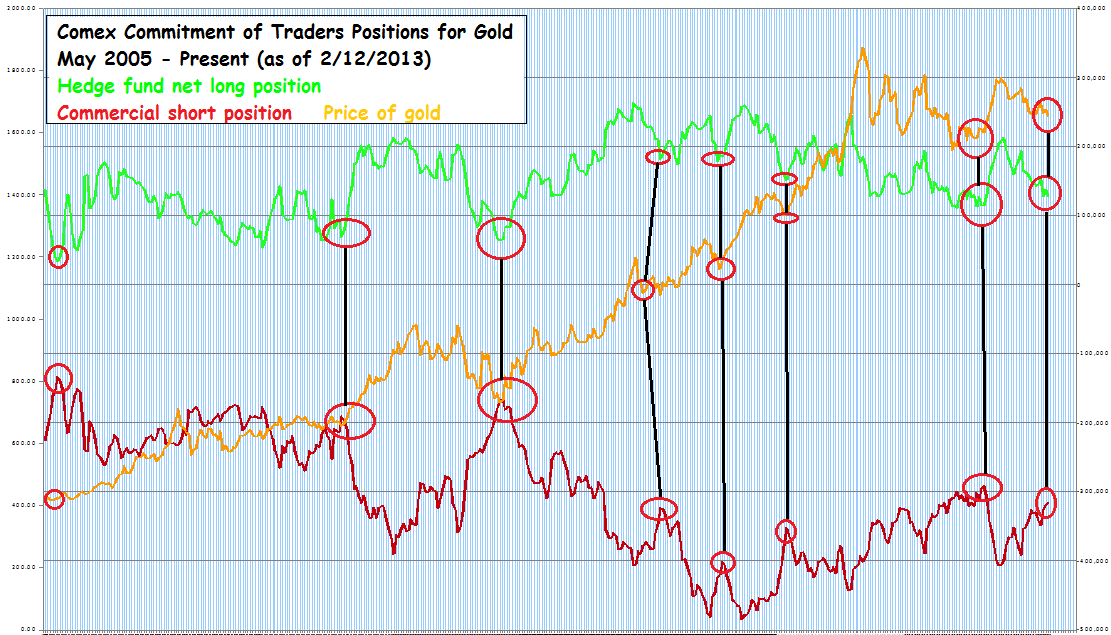
My fund partner has been keeping track of the weekly open interest and COT report positions since early 2005. This chart shows the weekly hedge fund net long open interest vs. the commercial trader gross short position. It dates back to May 2005 and runs through Friday's COT report. You can see from the aligned red circles that the gold price hits a "cyclical" bottom after a period in which the large hedge fund net long position hits a low point and the commercial gross short position also hits a "high" point (the short position is negative, so a high point on that data series represents a low short position).
Using this information, it appears to me that the current sell-off in gold/silver is at or near an end. If the cycle repeats - and I have no reason to believe it won't - traders and investors can take advantage of this set-up by either adding to existing gold/silver positions for putting on aggressive trading positions.
____________________________
FRIDAY, FEBRUARY 22, 2013
Gold discoveries from 1990 to 2011 have replaced only 56% of the gold mined during that same period - Metals Economic GroupThink about that statistic for a minute in the context of the fact that over the last two years eastern hemisphere Central Banks have been accumulating collectively more than half of the mined supply of gold in those two year. China and India combined account for about 50% of the mined supply over the last two years, and that assumes the published numbers from China are accountable. Most observers are certain China understates its published import numbers for gold (I can't imagine any Government not telling the truth).
The past couple of weeks have left many precious metals investors bordering on terrified. The good news is that, based on long term sentiment indicators which have proved to be 100% accurate buy signals over the last 12 years, this price correction is largely over:
My view is that the precious metals and mining stock sector is forming a big bottom and is getting ready to start a move that ultimately will culminate with new highs for gold, silver, and the mining stock indices. I would be so bold as to say that next to October 2008 and early 2001, this is probably the single best entry point that investors will get during the course of the precious metals bull market.You can read that entire commentary and see some incredible charts that show just how dismal the investor sentiment with regard to the precious metals has become here: Extreme Capitulation
The bottom line is that the fundamental factors supporting the relative value of the precious metals in relation to paper currencies become stronger by the day. To give you and idea of a possible price target for the price of gold over the next 12-24 months, here is a superb chart from The Daily Market Summary - LINK:
(Click on chart to enlarge)

____________________________
The Chart That Tells You All You Need To Know About Gold
“Eric, to my knowledge this is the only chart in existence that tells us when the next high and the next low for gold will occur. The turning points in the squares at the top of this chart are a golden gift from Mother Nature. I call them LTD’s. They are turning points specifically for gold bullion. Since this bull market in gold began a new high has occurred at every number [4] high and every grouped numbers [1] [2].

Gold is currently bottoming at LTD #3. The next high will occur at LTD #4. These turning points are not influenced by the Federal Reserve or any government activity. They do not care about who is buying or selling or how much they are buying or selling. They do not care about the ‘big boys’ or the ‘little boys.’....
______________________
Gold’s Death Cross is a buy signal for China
It is a treacherous moment for gold bugs.
The first whiff of future tightening from the US Federal Reserve has sent bullion into a nose-dive, triggering a much-feared “Death’s Cross” sell signal on gold futures.
Gold has dropped by over $100 an ounce in ten days, touching $1556 this morning. The HUI index of gold mining stocks broke down weeks ago – as so often leading gold itself by a few weeks – and has already crashed to levels last seen in 2009.
Goldman Sachs has cut its long-term forecast to $1,200. Credit Suisse and UBS are bearish.
Citigroup says the great bull market of the last 12 years is over. The “long cycle” has peaked. Economic recovery has yanked away the key support. So long as there are no big “street riots” this year, investors will stop buying precious metals as Armaggedon insurance and rotate instead into stocks that generate income. Such at least is the argument.
This is more of less what the market would look like and feel like if the gold rally really were to fizzle out, leaving behind an army of small investors who joined the party late and face deepening losses for twenty years – as they did from 1981 to 1999.
If it were true that the Fed is preparing to unwind QE, I would agree – up to a point – that gold faces a nasty squall. But all we had from the minutes was a comment that an undisclosed number of FOMC voters fear inflation and financial bubbles and think the Fed should stand ready to cut back on bond purchases earlier than thought.
How many times before have we heard “exit talk” from Fed hawks? We know who they are. They make a lot of noise. They are routinely ignored. The policy is dictated by the Fed Board and by Ben Bernanke, and there is little sign yet that the board is about to turn.
All the indications point the other way. Bernanke is targeting 6.5pc unemployment, and probably targeting nominal GDP growth of 4pc to 5pc as well.
The US faces fiscal tightening equal to 2pc of GDP this year at best. It is hard to see what is going to offset this. There is a snowball’s chance in hell that economic expansion will be strong enough in 2013 to force Fed tightening.
As for Japan – still the world’s biggest creditor – it has imposed a new policy mandate on the BoJ that implies massive easing over the next year.
The world economy as a whole is still in the grip of a deflationary vice. The global savings rate is still rising to fresh records above 24pc each year.
There is still a glut of capital sloshing around (and ready to go into gold) and a dearth of consumption. The overhang of excess capacity in global manufacturing is still there.
China’s investment is still running at 50pc of GDP, and its consumption is just 36pc, the most distorted economy in modern history.
The international trading system is still out of kilter. Globalisation is still going haywire and that is the underlying cause of the global crisis.
We remain in a 1930s slump. Until this is overcome it is a fair bet that the Anglo-Saxon central banks and their OECD allies (basically everybody except Frankfurt) will stay uber-loose to mitigate the damage.
The world’s policy-making elites know this, which is why central banks bought more gold last year than at any time since 1964. Turkey bought 164 tonnes, Russia bought 75 tonnes. Brazil, Korea, the Philippines, Kazakhstan, Iraq, Mexico, Paraguay, and others all added to their gold reserves.
The Chinese don’t declare gold purchases, but it is an open secret that are buying on every dip, as they have to do merely to keep the proportion stable at 2pc of their $3.3 trillion reserves. Chinese managers at SAFE must be licking their chops at this week’s chatter about a Death’s Cross.
I might add that China would have to buy vast amounts of gold to raise the share to 10pc, a figure mooted by some officials in Beijing.
Until the EMU debt crisis China was still willing to invest most of its fresh reserves in euro debt to diversify away from the dollar. Three years of incompetent crisis management – and no real solution in sight even today – have punctured any illusion in Beijing that monetary union is a sound undertaking.
Jin Zhongxia, head of the central bank’s research institute, said in an OMFIF paper this week that: “the debt crisis in the euro area has demonstrated the structural weakness of this currency.” Indeed.
Yes, the Chinese like the dollar again, but they already have a lot of dollars. They don’t have much gold compared to their peers.
So hold your nerve. The reality is that we have been moving for several years to an informal Gold Standard in which gold takes its place once again as a central store of value – a currency of sorts – in the mix of sovereign reserves.
The reason is obvious. The West is crippled by debt, and so is Japan. Governments are likely to seek an easy way out in the end. The rising reserve powers of Asia know this perfectly well.
As for the Death’s Cross – when the 50-day moving average falls below the 200-day average – it has not actually happened. It occurs only if the 200-day line is declining. This is not yet the case. As you can see below, the line is rising very slightly. That makes it a “Dark Cross”.

_________________________

No comments:
Post a Comment